
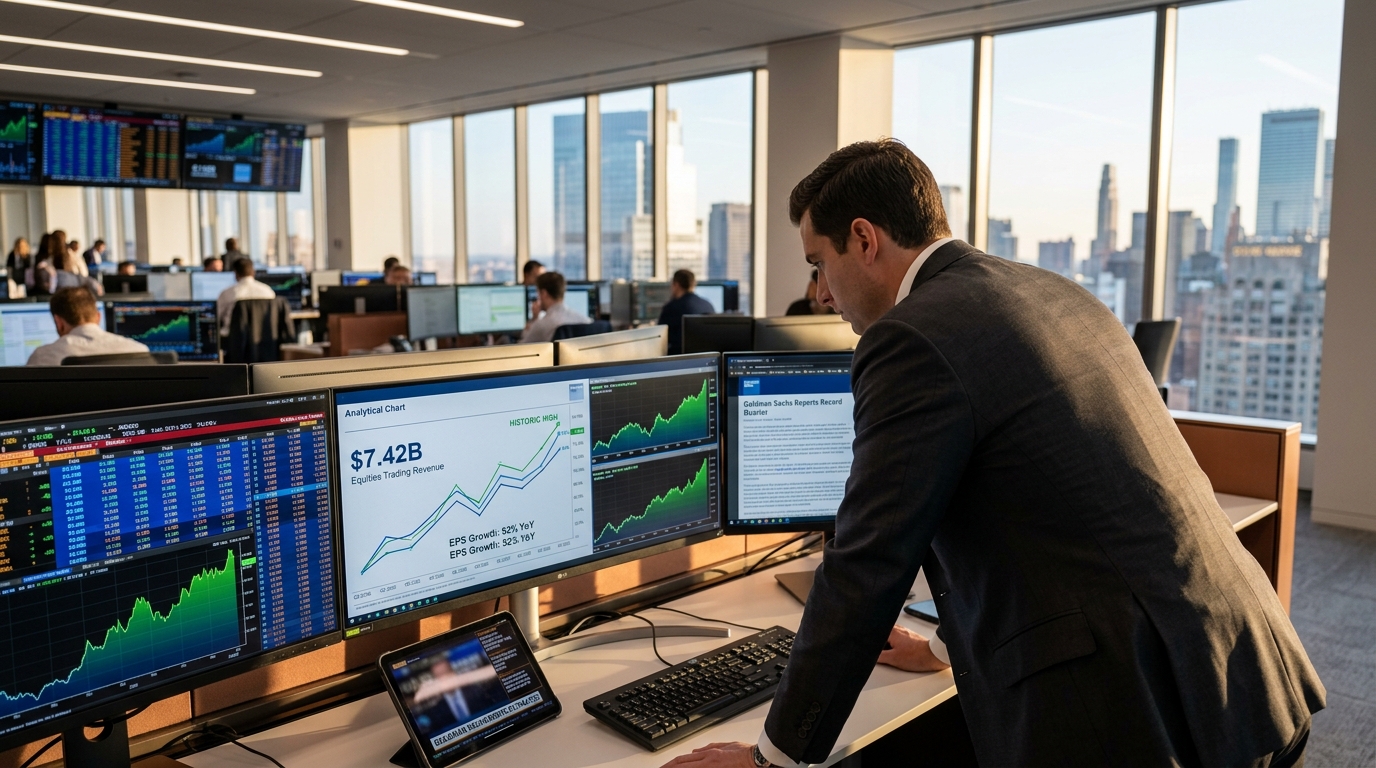
Here is what you need to know right now: Goldman Sachs just reported the strongest quarter in its 157-year history. Not strong relative to expectations. Not strong for a bank in a volatile environment. The strongest quarter. Period.
The numbers are hard to argue with.
Bullet Summary:
- Q2 2026 net revenues: $20.34B, up 39% year over year
- EPS came in at $20.98, roughly double the $10.91 earned in Q2 2025
- Equities trading revenue: $7.42B, a record quarter for Goldman’s equities business, up 72% year over year
- Investment banking fees: $3.40B, up 55% year over year
- Assets under supervision hit a record $4.041 trillion, up from $3.293 trillion a year earlier
- Return on equity reached 23.5%; the board increased the quarterly dividend to $5.00 per share from $4.50 (payable September 29, 2026 to shareholders of record September 1, 2026)
- GS stock surged on July 14, hitting an intraday high of $1,143.84 and closing at $1,140.00
What Is Actually Driving This
The surface-level story is easy: volatility was elevated. AI capital markets activity surged. Goldman traders were positioned well. But the more interesting part is the breadth of this result.
It was not just the trading desk.
Global Banking and Markets generated record revenues of $15.52B, up 53% year over year. Asset and Wealth Management contributed $4.60B, up 20% from a year ago, with higher management fees and private equity gains. The M&A pipeline also remained strong, with Goldman advising on more than $1 trillion in announced deals in the first half of 2026 alone. Goldman also played a lead underwriter role in the SpaceX IPO, which helped drive a jump in equity underwriting activity.
What Goldman’s CEO David Solomon called Momentum has accelerated throughout our businesses is actually the clearest signal that the capital markets recovery Wall Street has been waiting for since 2022 is no longer theoretical. It is showing up in the income statement at scale.
The Macro Context Behind the Quarter
This result does not exist in a vacuum. U.S. stocks rose on July 14, with the S&P 500 up about 0.4% and the Nasdaq up 0.9% after the June CPI report showed a 0.4% seasonally adjusted decline in June and a cooler-than-expected year-over-year pace. Crude oil sits around $79 per barrel for WTI. The VIX finished July 14 at about 16.5.
Fed Chair Kevin Warsh, who told Congress this week the Fed has “no tolerance for persistently elevated inflation,” has kept markets in a higher-for-longer posture. That rates environment, paradoxically, has been a tailwind for trading businesses. Elevated volatility and geopolitical tension have created the exact conditions Goldman’s trading and advisory desks were built for.
Slight tangent, but it matters: this is the third consecutive quarter that Goldman’s equities operation set an all-time record. That is no longer a one-time event driven by a single catalyst. Something structural is happening in that business.
Sector Rotation and Capital Flows
The Q2 bank earnings picture is more nuanced than the Goldman headline suggests. Wells Fargo posted a beat as well, earning $2.00 per share on $22.62B in revenue versus the $1.72 and about $21.87B expected. Citigroup also beat, posting $3.15 per share on $24.77B in revenue versus about $2.73 and $23.66B consensus. Goldman’s beat, however, was of a different magnitude entirely, and it reflects something important: the investment banks with the deepest trading franchises and the most robust deal pipelines are pulling ahead of more traditional deposit-and-lending models.
Morgan Stanley reports today, July 15. That number matters because if Morgan Stanley confirms similar strength in its institutional securities and wealth segments, then Goldman’s results are not an outlier. They are the leading edge of a broader sector repricing cycle in financials.
For traders watching sector flows, the financial sector ETF XLF has quietly been one of the stronger performers in Q3 2026 so far. If Morgan Stanley delivers, the question shifts from whether financials are working to how much further the rotation can run.
The Stock-Level Picture
GS entered Tuesday at roughly $1,045.91. After the earnings release, it hit a new high on July 14 with an intraday peak of $1,143.84 and closed at $1,140.00.
The forward P/E sits around the high teens based on current consensus. That looks compressed compared to large-cap tech multiples, but for a bank generating 23.5% return on equity and a strong advisory backlog, it is not an unreasonable place to be. The trailing P/E is also in the high teens on a TTM earnings basis, depending on the data source and the day’s price.
The efficiency ratio improved to 57.4% for the quarter, and 58.8% for the first half, down from 62.0% in H1 2025. That matters because it means Goldman is generating more revenue for every dollar of cost, and the leverage in the model is working.
Technical Framework
After the July 14 breakout, GS is now trading near or above prior resistance. The session high was set July 14 at $1,143.84. Key levels to monitor going forward:
- Support zone: The $1,067 to $1,080 range, which was the pre-earnings breakout trigger and prior resistance turned support
- 200-day moving average: Well below current price, offering a distant cushion for any broader market pullback
- RSI: Elevated after the single-day move. Traders who missed the initial gap may watch for a consolidation before assessing entry
- VWAP anchored from the earnings day open: A meaningful level for intraday positioning in the sessions immediately following a large earnings move
Volume on the July 14 session was notably elevated. That kind of volume on a new high typically signals institutional conviction rather than retail momentum chasing.
Scenario Modeling
Bull Case: Morgan Stanley confirms broad sector strength today, July 15. M&A activity continues accelerating. AI-related capital markets demand sustains elevated deal flow. GS tests the $1,200 range before year-end on continued earnings momentum. The dividend increase to $5.00 per quarter signals management confidence in capital return capacity.
Base Case: Goldman consolidates near the $1,100 to $1,140 range after the earnings surge. Trading revenue moderates from the record $7.42B as volatility normalizes in Q3. Investment banking remains healthy but the year-over-year comparisons get tougher after this blowout quarter. The stock grinds higher but the pace of gains slows.
Bear Case: Volatility collapses, compressing trading revenues sharply in Q3. The higher-for-longer rate environment begins weighing on deal activity as borrowing costs crimp M&A economics. The stock fades back toward the $1,000 to $1,030 range, where longer-term technical support had been prior to the earnings breakout. A macro shock or equity market correction could accelerate that move.
Active Trader Strategy Framework
A few things worth thinking through here. First, chasing a big gap on day one is usually a low-probability trade. The better question is whether the consolidation that follows sets up a cleaner entry for the next leg.
Second, the Morgan Stanley number today is the real-time stress test. If MS delivers a comparable beat in its institutional securities business, the financials sector thesis gets much stronger. If MS disappoints, Goldman’s move may prove to be stock-specific rather than sector-wide.
Third, position sizing and risk management matter more than usual around earnings-driven moves. Stocks that gap meaningfully in a single session often see elevated two-way volatility in the days that follow as options expire and institutional rebalancing occurs.
- Watch the $1,067 to $1,080 zone as support if a short-term pullback develops
- The $1,143.84 session high is the near-term resistance to watch for any continuation
- Morgan Stanley (reporting July 15) is a real-time sector confirmation or invalidation signal
- Keep risk parameters tight relative to position size given the post-earnings volatility expansion
The bigger picture here is that Goldman just demonstrated something the market has been debating for two years: when AI investment cycles combine with geopolitical volatility and a recovering M&A market, the premier investment banking franchises do not just participate. They extract an outsized share of the activity. Whether that advantage persists into Q3 is the question that matters now.
For informational and educational purposes only. Not investment advice. Trading involves risk, including loss of principal.