June 21, 2026
Bonds Are Flashing Red
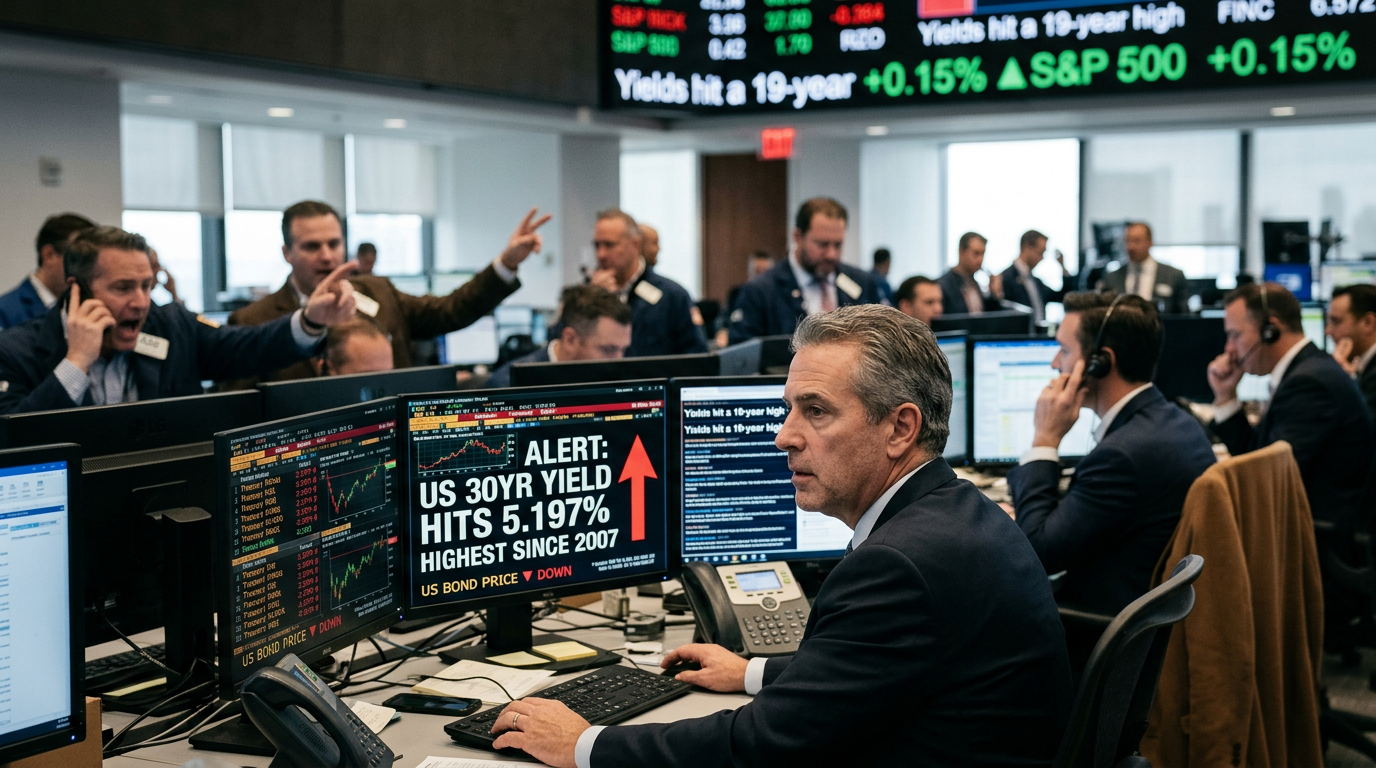
Yields hit a 19-year high. The Fed flipped hawkish. Stocks haven’t moved on either.
What the Bond Market Knows That Stocks Don’t
May 19. The 30-year US Treasury yield closes at 5.197%. Highest level since July 2007. Nobody on financial Twitter seems particularly bothered. The S&P 500 shrugs. Earnings season wraps cleanly. Growth stocks keep grinding higher.
And yet the bond market — the biggest, most institutionally-driven market on the planet — is doing something it has not done in nearly two decades.
That gap between what bonds are saying and what equities are doing is the thing worth paying attention to right now.
Here is what is actually driving it. Long-dated Treasuries have been selling off not because of one catalyst but because of three converging pressures that have been building since late 2025. First, inflation came back harder than most expected. CPI rose 3.8% year-over-year in April, then accelerated to 4.2% in May — the fastest annual rate since April 2023 and the third consecutive month of acceleration. Energy was the main culprit, up 23.5% over the past 12 months, with gasoline alone accounting for more than 60% of the May monthly increase. The Strait of Hormuz stayed effectively closed for extended stretches through the spring, and energy costs hit their highest levels in four years. Even with a provisional US-Iran agreement in mid-June, the geopolitical premium on oil did not fully unwind.
The Death of the Nasdaq?
Wall Street legend Marc Chaikin’s award-winning system turned bearish on software stocks two months before they crashed this year. Now, he’s warning that one AI lab’s breakthrough could CRASH the Nasdaq while igniting a $500 trillion wealth transfer. He’s found a little-known $40 “pre-IPO backdoor” into the private startup behind this economic sea change.
Second, the fiscal math. The CBO’s dynamic scoring of the One Big Beautiful Bill Act — signed July 4, 2025 — projects $4.7 trillion in additional deficits over the 2026-2035 budget window. The 2026 deficit alone is running around $1.9 trillion, or 5.8% of GDP. Federal debt held by the public is on track toward 120% of GDP by 2036. These are not projections from a partisan source. They are from the nonpartisan Congressional Budget Office, and the bond market has been reading them carefully.
Third, and this is the part most people are sleeping on: the Fed flipped.
On June 17, Kevin Warsh held rates at 3.50%-3.75% in his first meeting as Fed Chair. Unanimous vote. But the projections underneath the decision told a completely different story than the hold itself. The median dot for year-end 2026 moved to 3.8%, up from 3.4% in March. Nine of the 18 participating officials now expect at least one rate hike before December. The Fed revised its 2026 inflation outlook to 3.6% on headline PCE and 3.3% on core — both were 2.7% just three months ago. GDP growth was marked down to 2.2%. Unemployment held at 4.3%. Warsh also did not submit his own dot, which he confirmed at the press conference, and cut the written statement from 341 words in April down to 130 words in June. That last detail might sound minor. It is not. It is a deliberate signal about how this administration intends to communicate monetary policy going forward — less guidance, more optionality, more room to move.
By the following morning, markets were pricing a 60.7% probability of a hike as early as October, per CME FedWatch.
In at 9:35 AM. Out by 10.
I call it the “Opening Bell Breakout.” It’s the same setup I used to catch moves like 113% on GOOGL and 240% on META. I trade one simple 15-minute window each morning – and I’m usually done by 10 AM.
What’s interesting is how global this actually is. The 30-year UK gilt yield hit its highest level since 1998 during the same stretch. Japan’s 30-year bond yield hit its highest level on record. Investors all over the world are demanding more yield to hold long-term government debt. The reasons differ by country, but the direction is the same everywhere. This is not a uniquely American fiscal problem — it is a global sovereign debt story unfolding in slow motion, and it has been going on long enough that calling it temporary is starting to look like wishful thinking.
A Bank of America survey published May 19 found 62% of global fund managers expect the 30-year Treasury yield to eventually reach 6%. That is a level not seen since 1999. It is roughly 80 basis points above where the 30-year was trading in mid-June, after pulling back from its May peak. Sixty-two percent is not a fringe view. That is the majority of the people managing the world’s largest pools of capital telling you where they think this goes.
The sectors that feel this first are not hard to identify. Housing gets hit through mortgage rates, which track long yields and are unlikely to come down meaningfully near-term. Utilities, priced as bond proxies for years, face multiple compression when a risk-free 30-year yields nearly 5%. Commercial real estate, already under stress from vacancy rates, faces refinancing costs that keep climbing. High-growth technology stocks, built on models that discount future cash flows at the risk-free rate, have a structural headwind every time the 10-year moves higher. None of this is new. What is new is the Fed’s own projections now confirming the rate environment that bond markets have been reflecting since February.
There are beneficiaries, though they are less obvious. Investment grade corporate bonds in the two-to-five year range are offering yields that look genuinely attractive relative to the post-financial-crisis era — the Bloomberg US Corporate Bond Index average yield is north of 5%. Financials with floating-rate assets do well in rising-rate environments, credit quality permitting. Short-duration fixed income, which spent years yielding almost nothing, is back in the conversation as a real allocation.
Apple’s Starlink Update Sparks Huge Earning Opportunity
Most people brushed off Apple’s new Starlink integration for iPhones.
Mode Mobile saw something bigger: billions of new users suddenly within reach.
Mode’s EarnPhone already reaches 490M+ users that have earned over $1B, and that’s before global satellite coverage. With SpaceX eliminating “dead zones,” Mode’s earning technology can now reach billions more in unbanked and rural populations worldwide.
Their global expansion is perfectly timed, and investors like you still have a chance to invest in their pre-IPO offering at $0.50/share. But that window is fading fast as their share price is expected to move on 05/29.
With their recent 32,481% revenue growth and newly reserved Nasdaq ticker, Mode is edging closer to a potential IPO.
Secure your shares at $0.50/share before price changes on 05/29!
Please read the offering circular at invest.modemobile.com. This is a paid advertisement for Mode Mobile’s Regulation A Offering.
Bond vigilantes do not run a group chat. There is no coordination. It is just a critical mass of institutions independently deciding that holding long-term US debt at the current yield is not worth the risk — and acting on that conclusion simultaneously. When enough of them do it, yields rise, borrowing costs across the economy go up, the deficit gets larger through higher interest payments, and the private sector ends up paying more for money at exactly the moment it was hoping to pay less.
The equity market and the bond market are not telling the same story right now. One of them is wrong. What makes this moment genuinely uncertain is that the equity market has been wrong before and still taken years to correct — and the bond market has occasionally overreacted to fiscal fears that never fully materialized. The 10-year yield exceeding the S&P 500’s earnings yield by the widest margin since 2002 is a real warning. Whether equities choose to hear it this quarter or two years from now is a different question entirely.
Worth watching closely going into Q3.