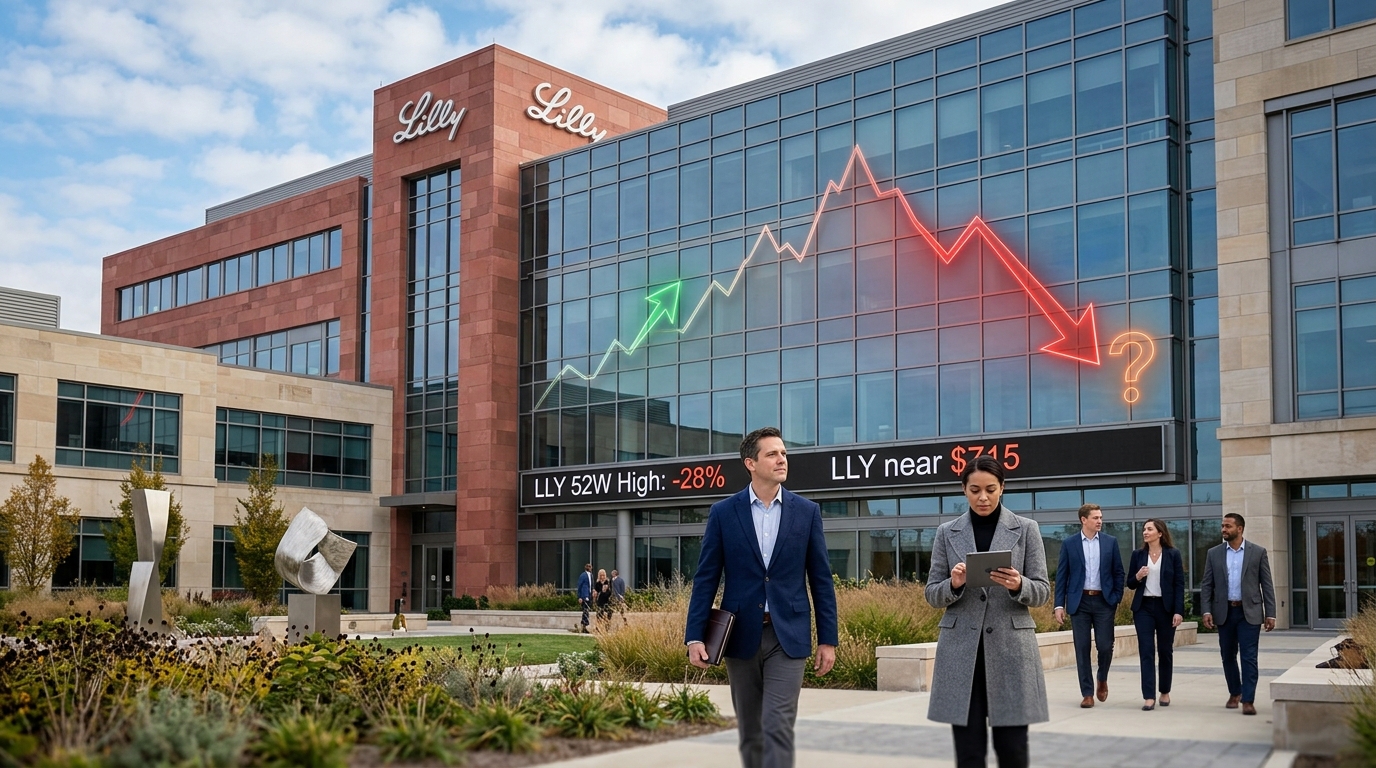
Eli Lilly and Company (LLY) entered 2026 as one of the most closely watched large-cap equities in the world, riding the extraordinary commercial momentum of its GLP-1 franchise. But as of May 6, 2026, shares are trading near $715, down approximately 28% from their 52-week high of roughly $972 set in mid-2025. That magnitude of decline in a company still generating accelerating revenue growth deserves serious analytical attention from active traders and institutional participants alike.
The Macro Backdrop and Why It Matters for LLY
The current macro environment is not doing speculative healthcare investors any favors. The 10-year Treasury yield is holding near 4.55%, compressing the multiples that growth-oriented pharmaceutical companies had enjoyed when rates were closer to zero. Inflation, while moderating, remains sticky enough that the Federal Reserve has held its policy rate in the 5.25% to 5.50% range through the first half of 2026, with market pricing for rate cuts pushed to late 2026 at the earliest. Risk-off rotation has pressured high-multiple healthcare names broadly, with the XLV health care sector ETF underperforming the S&P 500 by approximately 6 percentage points year-to-date.
The S&P 500 itself is trading near 5,420 after a volatile first quarter that saw a drawdown of nearly 9% followed by a partial recovery. In that environment, institutional capital has rotated toward defensive value and energy, leaving growth-oriented large-cap healthcare in an awkward in-between position – too expensive for pure value mandates, too macro-sensitive for aggressive growth mandates.
The Revenue Picture: Still Exceptional by Any Measure
What makes Lilly’s pullback analytically interesting is the disconnect between price action and fundamental trajectory. In its most recently reported quarter, Lilly posted total revenue of approximately $12.7 billion, representing year-over-year growth of roughly 45%. That figure was driven almost entirely by Mounjaro and Zepbound – the tirzepatide-based products at the center of the GLP-1 revolution in metabolic disease treatment.
- Mounjaro revenue exceeded $3.8 billion in the quarter, up from approximately $1.8 billion in the same period a year prior – more than doubling year-over-year.
- Zepbound, approved specifically for obesity and launched in late 2023, contributed approximately $2.3 billion in the quarter, demonstrating rapid market penetration.
- Combined GLP-1 revenue for the quarter approached $6.2 billion, meaning the franchise alone would rank among the top revenue generators in global pharmaceutical history on an annualized basis.
- Gross margins remain strong at approximately 80.5%, consistent with the company’s historical profile and reflecting the premium pricing power Lilly has maintained despite growing competition from Novo Nordisk’s semaglutide products.
Full-year 2025 revenue came in near $45 billion, and consensus analyst estimates for 2026 are currently clustered around $58 billion to $62 billion, implying continued growth in the 28% to 37% range even as the base grows increasingly large. That is not the profile of a company whose stock should be in a prolonged decline without a clear fundamental catalyst for the reversal.
Valuation Reset: What 28% Lower Actually Means
At the peak near $972, Lilly was trading at approximately 55 times forward earnings – a multiple that priced in near-perfection and left no room for execution risk, competitive pressure, or macro headwinds. At $715, the math looks meaningfully different.
- Forward price-to-earnings at current levels: approximately 38 to 40 times 2026 consensus estimates of roughly $22 to $24 per share in adjusted EPS.
- Price-to-sales ratio has compressed from approximately 22 times to approximately 15 times on trailing twelve months revenue – still a premium, but more defensible given the growth rate.
- EV-to-EBITDA has moved from approximately 50 times to approximately 35 times, which, while elevated in absolute terms, is increasingly reasonable relative to Lilly’s compounded earnings growth rate of approximately 40% over the last three years.
- The PEG ratio – price-to-earnings divided by growth – has declined from over 1.3 to approximately 0.9 based on the current forward multiple and the projected 2026 EPS growth rate near 45%. A PEG ratio below 1.0 historically signals that growth is not being fully compensated in the price.
By pharmaceutical peer comparison, Novo Nordisk trades at approximately 24 times forward earnings with a slower projected growth rate, AstraZeneca trades at approximately 19 times, and Johnson & Johnson at approximately 15 times. Lilly’s premium is real but reflects a fundamentally different growth trajectory.
The Competitive Risk: How Real Is the Semaglutide Pressure?
The bear argument on Lilly centers on competitive dynamics within the GLP-1 space. Novo Nordisk’s semaglutide products – Ozempic for diabetes and Wegovy for obesity – remain dominant in unit volume terms, and multiple pipeline entrants from companies including Amgen, AstraZeneca, and Roche are advancing oral GLP-1 formulations that could eventually reduce the commercial exclusivity Lilly and Novo have enjoyed.
However, the data does not yet support a thesis of rapid Lilly market share erosion. Tirzepatide’s dual GIP and GLP-1 mechanism has demonstrated superior weight loss outcomes in clinical trials – averaging approximately 20% to 22% body weight reduction at maximum dose versus approximately 15% for semaglutide. That differentiation has supported formulary wins and maintained prescription growth even as capacity constraints have partially been resolved through manufacturing expansion. Lilly has invested over $9 billion in manufacturing capacity over the past two years specifically to address supply limitations, and those investments are beginning to yield results in terms of product availability.
Pipeline Depth Beyond GLP-1
Serious analysis of Lilly’s investment case cannot stop at tirzepatide. The company’s pipeline carries multiple late-stage candidates with significant commercial potential that are not adequately reflected in current consensus models.
- Donanemab for Alzheimer’s disease received FDA approval in mid-2024 and early commercial data suggests uptake is accelerating, with peak sales estimates from sell-side analysts ranging from $5 billion to $8 billion annually.
- Lebrikizumab for atopic dermatitis is generating meaningful revenue in dermatology, competing against AbbVie’s Dupixent in a market estimated to exceed $15 billion annually by 2027.
- Orforglipron, an oral GLP-1 agonist in Phase 3 trials, could represent the next commercial step-change for Lilly by eliminating the injectable format that has been a barrier to adoption for a meaningful patient segment.
- Tirzepatide is itself in clinical development for heart failure, sleep apnea, and non-alcoholic steatohepatitis – label expansions that could substantially broaden the addressable patient population beyond current diabetes and obesity indications.
Technical Structure: Key Levels for Active Traders
From a technical perspective, LLY’s current structure reflects a stock working through a meaningful correction after an extended run. The 200-day moving average, which served as a long-term directional anchor through 2023 and 2024, is currently near $810. The stock is trading approximately 12% below that level, which historically represents a zone of extended deterioration in large-cap growth names.
Near-term support is identified in the $695 to $710 range, which corresponds to a prior consolidation zone from the first half of 2024. A sustained close below $695 would open a path toward the $660 to $670 area, where a more significant volume shelf exists based on historical trading activity. Resistance sits at $750 and more meaningfully at $790 to $800, where the breakdown from the 200-day average occurred.
Relative strength indicators are recovering from oversold conditions seen in March 2026 but have not yet generated a sustained momentum reversal. Volume patterns during recent up days have been modest, suggesting institutional accumulation has not yet become aggressive. VWAP anchored to the 52-week high still sits near $895, representing a significant reclaim target for any structural recovery thesis.
Scenario Modeling
Bull Case
If Lilly delivers Q1 2026 earnings above the $12.9 billion revenue consensus with upward guidance revision, tirzepatide prescription data continues to show market share gains, and the Fed signals a rate cut path in June 2026, shares could retest the $800 to $840 range within a two-to-three month window. A successful orforglipron Phase 3 readout, expected in late 2026, could add a significant catalyst layer supporting a move toward prior highs above $900.
Base Case
Revenue growth continues at approximately 30% for 2026, earnings come in near the high end of current consensus at $23 to $24 adjusted EPS, and the stock consolidates in the $700 to $780 range as institutional investors assess the competitive landscape and macro direction. Valuation stabilizes around 35 to 38 times forward earnings, and shares grind modestly higher through the second half of 2026 as clarity on the competitive environment improves.
Bear Case
Disappointing prescription data, formulary access challenges with major pharmacy benefit managers, or an unexpected clinical setback in a key pipeline asset could push shares toward the $640 to $660 support zone. If macro conditions deteriorate significantly – particularly if the 10-year yield moves toward 5.0% – multiple compression could extend even without a fundamental deterioration in business performance. A sustained break below $650 would represent a structural failure of the current base pattern.
Active Trader Strategy Framework
Traders approaching LLY should prioritize defined risk parameters given the stock’s recent volatility profile. The 28-week average true range has expanded meaningfully, with daily moves of 2% to 4% becoming more common than the 0.5% to 1% sessions typical of 2023. That means position sizing must account for a wider expected trading range than Lilly’s historical behavior would suggest.
Key levels to monitor in the near term include the $695 support floor, the $750 near-term resistance, and the $810 200-day moving average as the structural benchmark for recovery. Earnings and any pipeline data releases represent the highest-probability catalyst windows for significant directional movement. Options implied volatility on LLY has been elevated, with 30-day IV in the 35% to 40% range compared to a 12-month historical average near 25%, reflecting uncertainty but also creating opportunities for structured approaches to positioning.
Risk management discipline is essential: a stock with Lilly’s fundamental quality can still inflict significant capital damage on traders who are positioned with excessive size or insufficient defined downside parameters, particularly in a macro environment where sentiment can shift abruptly on rate news.
Conclusion
Eli Lilly at $715 is a fundamentally different risk-reward proposition than Eli Lilly at $972. The pullback has compressed valuation meaningfully, the underlying business continues to generate exceptional revenue and earnings growth, and the pipeline depth provides multiple potential catalysts over the next twelve to eighteen months. That does not eliminate risk – competitive dynamics, macro headwinds, and valuation still demand respect. But for active traders and institutional participants who have been waiting for a more rational entry point into one of the most compelling growth stories in large-cap healthcare, the current setup warrants serious, disciplined analytical attention. Preparation and process, not emotion, will determine outcomes here.
For informational and educational purposes only. Not investment advice. Trading involves risk, including loss of principal.