September 3, 2026
ETF flows flipped on day one of September. The $77,000 floor is all that matters now.
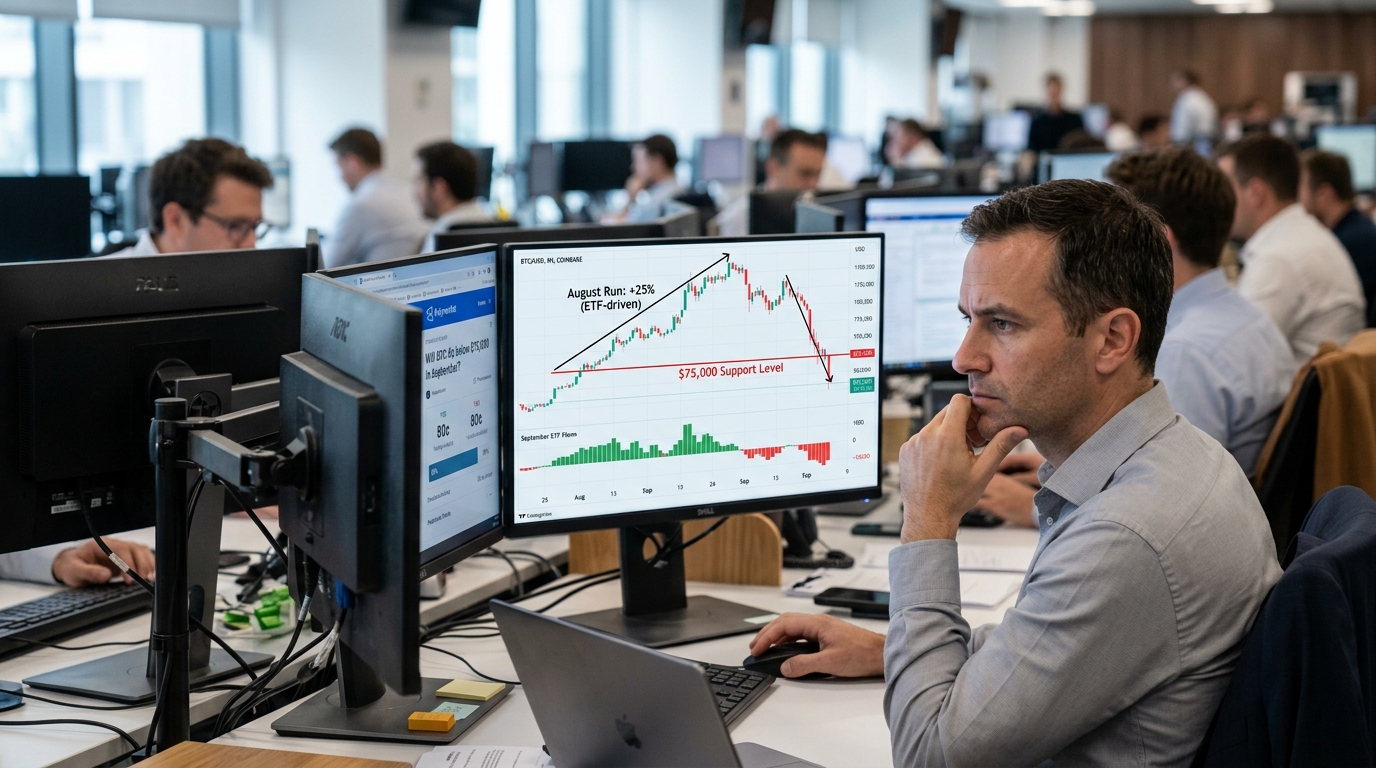
Bitcoin opened Thursday near $77,300 and was trading near $77,900 by 8 a.m. ET, roughly flat on the week and sitting below the late-August high near $80,800. The bounce matters less than what surrounds it: on-chain demand is deteriorating, ETF flows have already flipped, and real-money prediction markets are pricing a high probability that the coin revisits territory not seen since before August’s run.
One Date – November 27 – Could Reset the American Economy for Good
A $10 TRILLION shift is moving through Washington, D.C. Forensic accountant Joel Litman believes those who understand it before November 27 have a rare opportunity to avoid disaster and get positioned early.
Market Snapshot
Kalshi traders now price roughly an 80% chance that Bitcoin trades below $75,000 at some point during September, while a drop below $72,500 is priced at around 53%. The probability falls to about 34% for $70,000 and about 14% for $65,000. These are not fringe bets. Kalshi is CFTC-regulated, and the contracts reflect real money pricing real outcomes.
US spot Bitcoin ETFs drew $3.52 billion in net inflows during August, their best monthly total of 2026, as BTC gained about 25%, its strongest monthly performance since November 2024. September opened differently. The first session brought a $236.5 million net outflow, led by IBIT redemptions.
Oil Surge Predicted…But Are You Ready?
Do you own oil and gas stocks? Or are you thinking about buying some?
If so, you need to see my #1 oil play for 2026 But it’s NOT oil stocks, futures, or anything you’ve likely heard about.
Rather, it’s an unusual way to potentially bank monthly income from the oil and gas markets.
CryptoQuant data now shows Bitcoin’s apparent demand turning negative again after a brief reprieve during the August rally. The indicator had climbed from roughly -272,000 BTC in June to around -32,000 BTC, but never durably crossed into positive territory. With short-term holders still realizing profits, fading demand means sold coins are not being matched by new buyers, raising the risk of another leg lower if demand does not recover quickly.
Stocks in Focus
- IBIT (BlackRock iShares Bitcoin Trust): IBIT led Tuesday’s redemptions as US spot Bitcoin ETFs posted a $236.5 million net outflow on September 1. The September reversal in flows, led by IBIT redemptions, makes this the cleanest institutional sentiment gauge for the week. Watch whether outflows persist or reverse.
- MSTR (Strategy): The latest 4,603 BTC purchase takes Strategy’s holdings to 845,050 BTC at an average cost of $75,412 per coin. The purchase resumed after a roughly 10-week pause, adding the coins for approximately $369.7 million. That average cost sits right at the $75,000 level Kalshi traders are watching. A BTC move to $72,500 would put Strategy materially underwater on its most recent tranche.
- COIN (Coinbase): Trading volume is the revenue driver, and Bitcoin ETF monthly trading volume rose approximately 49% to $58.63 billion in August. Any September contraction in crypto volumes translates directly to near-term earnings pressure on Coinbase.
Technical Radar
Support sits at $77,767 and $77,000, with resistance clustered around $79,184 to $79,400, then $81,000 to $81,500. Everything rests on $77,057, the floor this range has held since the August breakout, because losing it removes support all the way to $62,207. One analyst warned that continued weakness could turn $77,000 from support into resistance.
URGENT: Follow this energy stock pattern
When Microsoft paid to restart Three Mile Island, Constellation Energy soared more than 450%.
When Amazon signed a $650 million nuclear deal, Talen Energy’s shares more than doubled in a year.
Now Wall Street veteran Whitney Tilson says the same pattern is pointed directly at the energy market where Berkshire’s new CEO is leaving big clues right now. He’s revealing everything in an urgent new presentation.
On the upside, a daily close above $82,656 would open $91,719, and only a move through that level argues the bull phase is back, with $100,782 beyond it. That scenario requires a catalyst that is not visible this week.
Risk Radar
Binance alone carries $3.00 billion in long liquidation leverage below current price against $1.80 billion in short leverage above it. That asymmetry matters: a modest drop through $77,000 could accelerate into a liquidation cascade rather than a clean technical test. Strategy resumed Bitcoin purchases after a roughly 10-week pause, deploying about $369.7 million. A widely used Crypto Fear & Greed gauge was recently showing a mid-60s reading, pointing to complacent positioning during the momentum stall. Complacency plus leverage is the combination traders should respect.
The Cheat Sheet
- Top Market Theme: August’s ETF-funded Bitcoin rally is being sold into by on-chain participants, and prediction markets are pricing the hangover.
- Stock to Watch: MSTR. Its $75,412 average cost on 845,050 BTC is almost exactly the line Kalshi traders are betting gets broken this month.
- Sector to Watch: Crypto-adjacent equities (IBIT, COIN, MSTR) are all leveraged to the same binary: does $77,000 hold or not?
- Biggest Risk: Long liquidations below $77,000 accelerating into the $72,000 to $72,500 zone that bears are already targeting.
- Biggest Opportunity: A confirmed reclaim of $79,400 with positive ETF flows would squeeze the prediction-market bears and open a retest of $81,500.
- One Thing to Remember: The August rally was bought almost entirely by ETFs. When funds stop buying, there is no secondary bid below them until $72,000.